Understanding US segregation maps is crucial for comprehending the deep-seated historical inequalities that continue to impact American society today. These powerful visual tools reveal the systematic policies like redlining and racial covenants that deliberately separated communities based on race and ethnicity. Exploring these maps helps us trace the origins of wealth disparities, educational gaps, and health outcomes in many urban and suburban areas across the United States. They serve as navigational guides to the past, illuminating how discriminatory practices, although officially outlawed, left an indelible mark on the landscape of American cities. Informational insights from these maps are trending as people seek to understand systemic racism and advocate for more equitable futures, highlighting persistent challenges and ongoing efforts toward integration and justice in 2026. This content aims to educate and inform a US audience on the profound legacy of segregated communities.
What role did federal policies play in US segregation?
Federal policies played a significant role in US segregation, notably through programs like the Federal Housing Administration (FHA) and the Home Owners' Loan Corporation (HOLC). These agencies institutionalized redlining, denying mortgage insurance to predominantly Black and immigrant neighborhoods. This government-backed discrimination actively fueled residential segregation, creating lasting patterns of inequality nationwide.
How do economists measure modern segregation?
Economists measure modern segregation using various indices, such as the dissimilarity index, isolation index, and exposure index. These tools quantify the evenness of racial distribution within cities, the likelihood of encountering someone from a different group, and the extent to which groups live in homogenous neighborhoods. These metrics help track ongoing patterns.
What is the Fair Housing Act's significance regarding segregation?
The Fair Housing Act of 1968 outlawed discrimination in housing sales, rentals, and financing based on race, religion, national origin, sex, familial status, and disability. Its significance lies in legally prohibiting overt discriminatory practices like redlining and racial covenants, aiming to dismantle systemic segregation. While impactful, its full enforcement remains an ongoing challenge.
Can local zoning laws contribute to segregation?
Yes, local zoning laws can significantly contribute to segregation, often unintentionally or through subtle means. Exclusionary zoning practices, such as minimum lot sizes, limits on multi-family housing, and high development costs, can effectively price out lower-income residents and perpetuate economic and racial segregation within communities. This maintains existing divides.
What are some ongoing efforts to address US residential segregation?
Ongoing efforts to address US residential segregation include fair housing initiatives, affordable housing development, community revitalization projects, and policies promoting inclusive zoning. Advocates also focus on combating predatory lending, fostering equitable school funding, and investing in infrastructure in historically disadvantaged neighborhoods. These actions aim to reverse past harms.
Have you ever wondered how America’s neighborhoods became so distinctly divided? The story of US segregation maps unveils a complex history. These maps, particularly those from the mid-20th century, visually document systematic racial discrimination. They highlight how government policies and private sector practices deliberately created segregated communities. Understanding these maps is key to grasping the roots of many societal challenges we face.
Residential segregation in the United States did not happen by accident. It was often engineered through explicit policies. Redlining, for example, designated certain neighborhoods as risky for investment. These areas were almost always Black or immigrant communities. This practice severely limited access to loans and insurance for residents. The impact of such maps can still be observed in wealth gaps and public services today.
Racial covenants were another powerful tool for enforcing segregation. These legal clauses prevented property owners from selling to or living near certain racial or ethnic groups. While deemed unenforceable by the Supreme Court in 1948, their historical presence shaped housing patterns. The legacy of these agreements continues to influence property values and demographic distribution. Many communities still grapple with these historical boundaries.
Today, discussions around US segregation map resources are more vital than ever. We are actively exploring how these historical maps illustrate ongoing inequalities. They connect past policies to present-day challenges in education, health, and economic opportunity. Understanding this history is the first step toward building more inclusive and equitable communities across the nation. It helps us see the patterns beneath the surface.
Here is a concise look at some key aspects of US segregation maps:
| Aspect: | Description: |
| Primary Tool: | Redlining maps by HOLC (Home Owners' Loan Corporation) |
| Timeframe: | Primarily 1930s-1960s, with lasting effects |
| Purpose: | To assess mortgage lending risk, often based on race |
| Key Impact: | Limited investment in minority neighborhoods, wealth disparity |
| Legal Actions: | Racial covenants, exclusionary zoning practices |
| Modern Relevance: | Understanding current residential, economic, and social inequalities |
What Others Are Asking?
How did redlining create segregation in the US?
Redlining was a discriminatory practice where financial institutions denied services, like mortgages, to residents of certain areas based on race or ethnicity, regardless of their qualifications. Maps designated these areas, typically minority neighborhoods, as high-risk, leading to disinvestment and perpetuating racial segregation, limiting wealth building for generations within those communities.
Are US cities still segregated today?
Yes, many US cities remain significantly segregated today, although the mechanisms have shifted from overt legal policies. Factors like economic disparities, housing costs, school district boundaries, and historical legacies of redlining contribute to ongoing residential segregation. Data consistently shows racial and ethnic enclaves persist across metropolitan areas.
What are racial covenants and their impact?
Racial covenants were legal agreements attached to property deeds that prohibited the sale or occupancy of land to specific racial or ethnic groups. Though unenforceable since 1948, their widespread use historically cemented residential segregation. They severely restricted housing options for minorities, concentrating them into specific areas and contributing to lasting wealth and opportunity gaps.
Can I find a historical US segregation map?
Yes, many historical US segregation maps, particularly those showing redlining boundaries, are available online. Institutions like the University of Richmond's Mapping Inequality project and local historical societies provide digitized versions. These resources offer powerful visual evidence of past discriminatory housing policies, revealing specific neighborhood designations.
How does residential segregation affect education?
Residential segregation profoundly impacts education by concentrating poverty and disadvantage in specific school districts. This often leads to unequal funding, fewer experienced teachers, and limited resources in segregated minority schools. Consequently, it perpetuates disparities in educational outcomes, hindering upward mobility and reinforcing systemic inequalities.
FAQ
What is a US segregation map?
A US segregation map visually represents historical and ongoing patterns of racial and ethnic separation in American communities. These maps often highlight areas affected by discriminatory housing policies like redlining, revealing the geographic legacy of systemic inequality across the nation.
Who created segregation maps?
Many early segregation maps, particularly redlining maps, were created by government-sponsored entities like the Home Owners' Loan Corporation (HOLC) in the 1930s. Real estate agents and developers also used similar visual tools to enforce racial covenants and discriminatory housing practices.
Why did segregation maps exist?
Segregation maps existed to enforce and visualize racially discriminatory housing and lending policies. Their purpose was often to control property values, manage perceived financial risks, and maintain racial hierarchies by limiting housing options and opportunities for specific racial and ethnic groups.
How do segregation maps reveal inequalities?
Segregation maps reveal inequalities by showing direct correlations between historical housing policies and current disparities. They illustrate how deliberate exclusion led to concentrated poverty, limited access to resources, and entrenched economic and social gaps that persist in many segregated neighborhoods today.
As the voice behind this important information, I envision a persona dedicated to clear, empathetic communication. Height: 5'10, Build: Average, Hair: Brown, Eyes: Hazel, Age Range: 35-50, Ethnicity: Diverse and inclusive perspective.
Historical redlining impact; persistent residential segregation; racial covenants legacy; economic and social disparities; modern segregation patterns; understanding systemic inequalities.

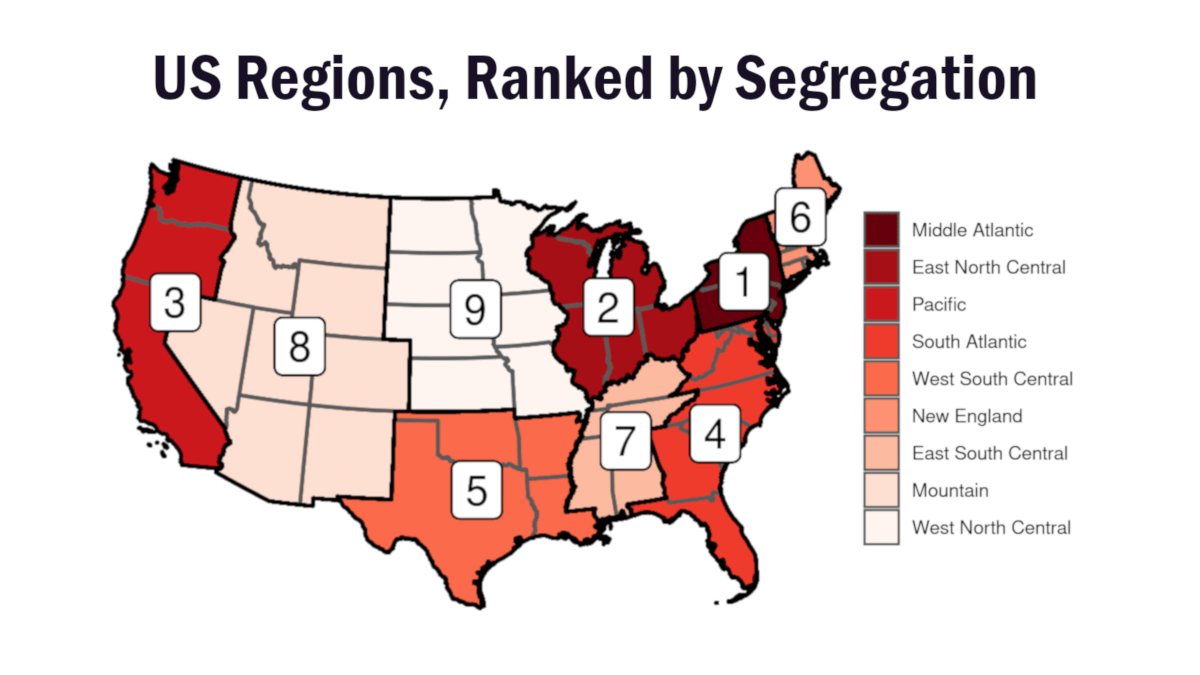
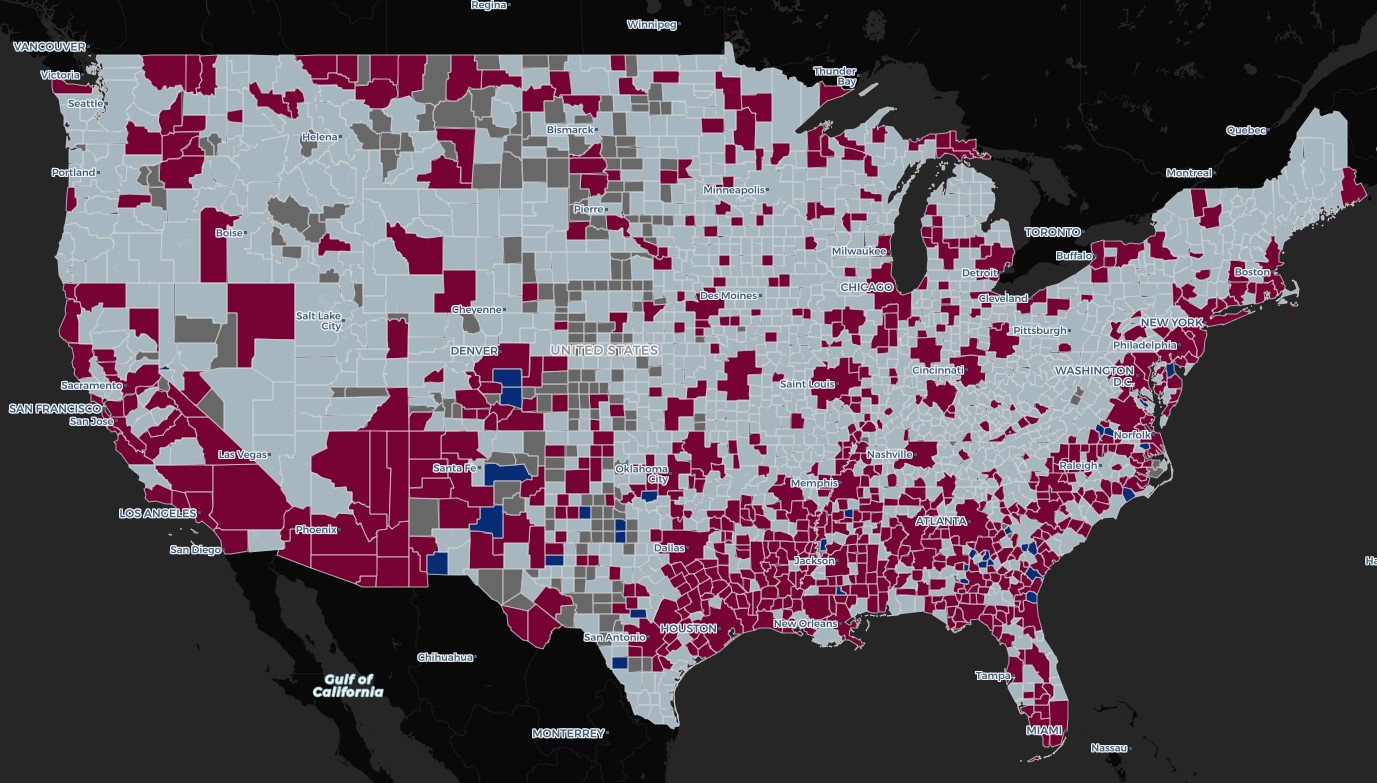


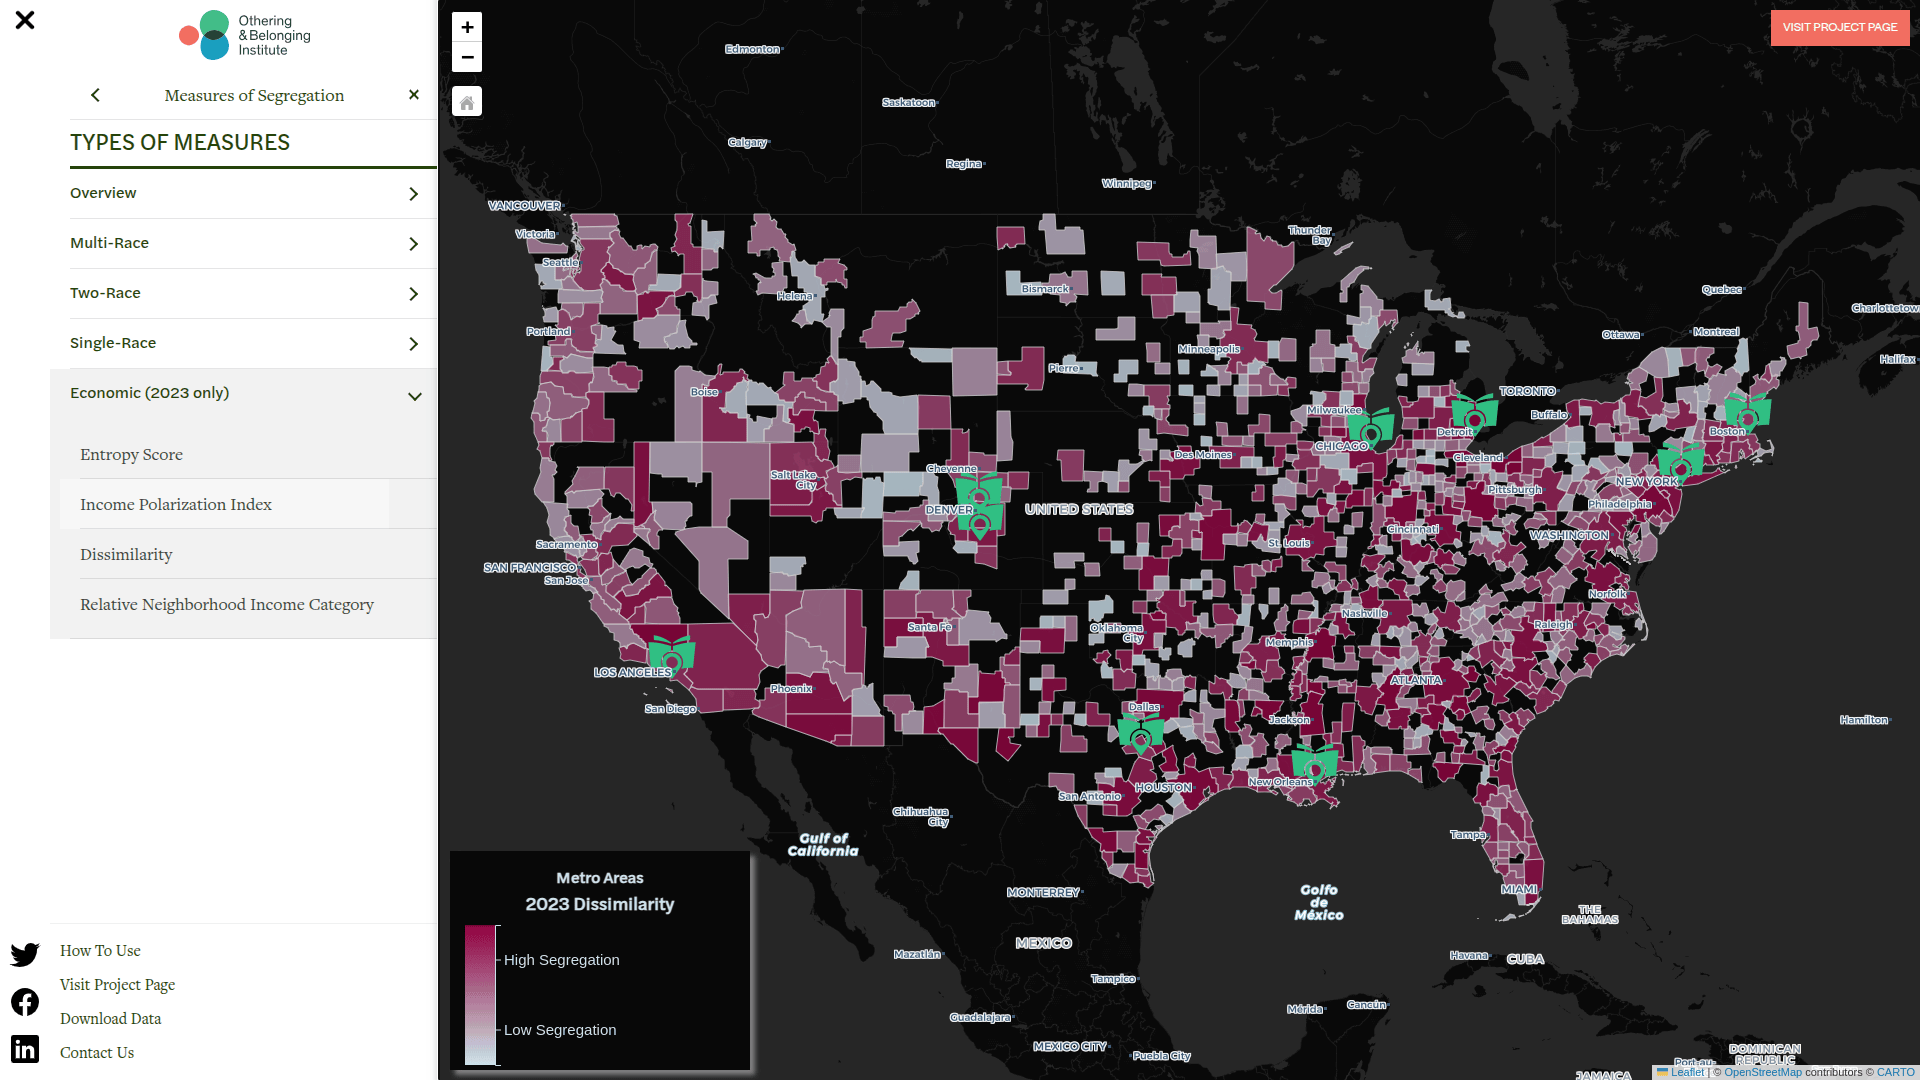
United States History I II Reading Assignment Civil Rights US 26 . Equity Metrics Othering Belonging Institute Segregation Map Preview Image 16x9 . What The 2020 Census Reveals About Segregation Othering Belonging Nationalmap . Segregation Map America S Cities 50 Years After The Fair Housing Act Chicago Map 2016 280 . Handout F Segregation Laws Map 1953 National Leader In Civic 5.6 Handout F Segregation Laws Map 1953 Img


Segregation Map America S Cities 50 Years After The Fair Housing Act Segregation Us Cities Promo 2300 . The African American Struggle For Civil Rights US History CNX History 28 05 Brown . Segregation Map America S Cities 50 Years After The Fair Housing Act DC Map 2016 600 . Mapping Segregation The New York Times Newyork . Mapping Segregation The New York Times Chicago
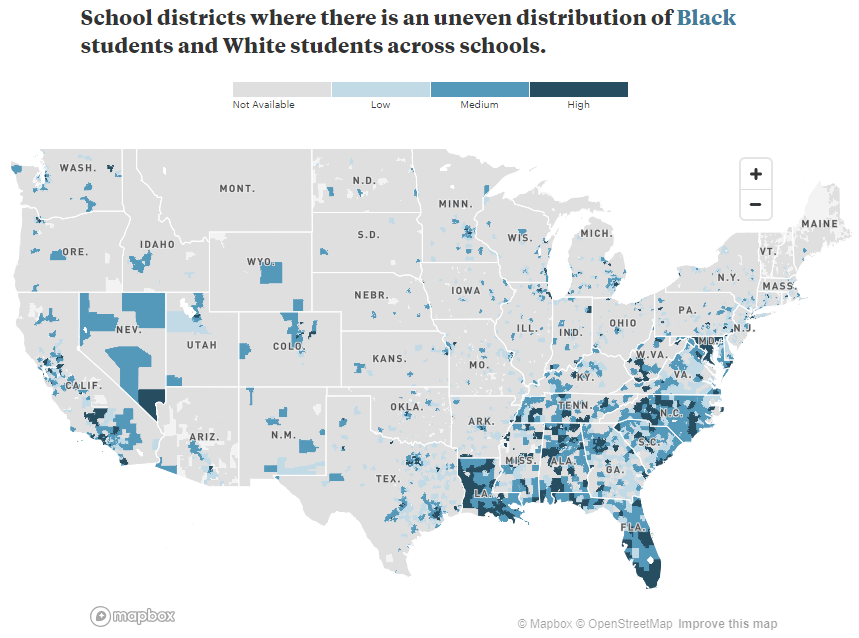


Still Separate Still Unequal Teaching About School Segregation And Jumbo V2 . Segregation Map America S Cities 50 Years After The Fair Housing Act Usa Sig . Mapping Segregation The New York Times Census Race Map V2 . Segregation Map America S Cities 50 Years After The Fair Housing Act Houston Map 2016 280 . Mapping Segregation The New York Times


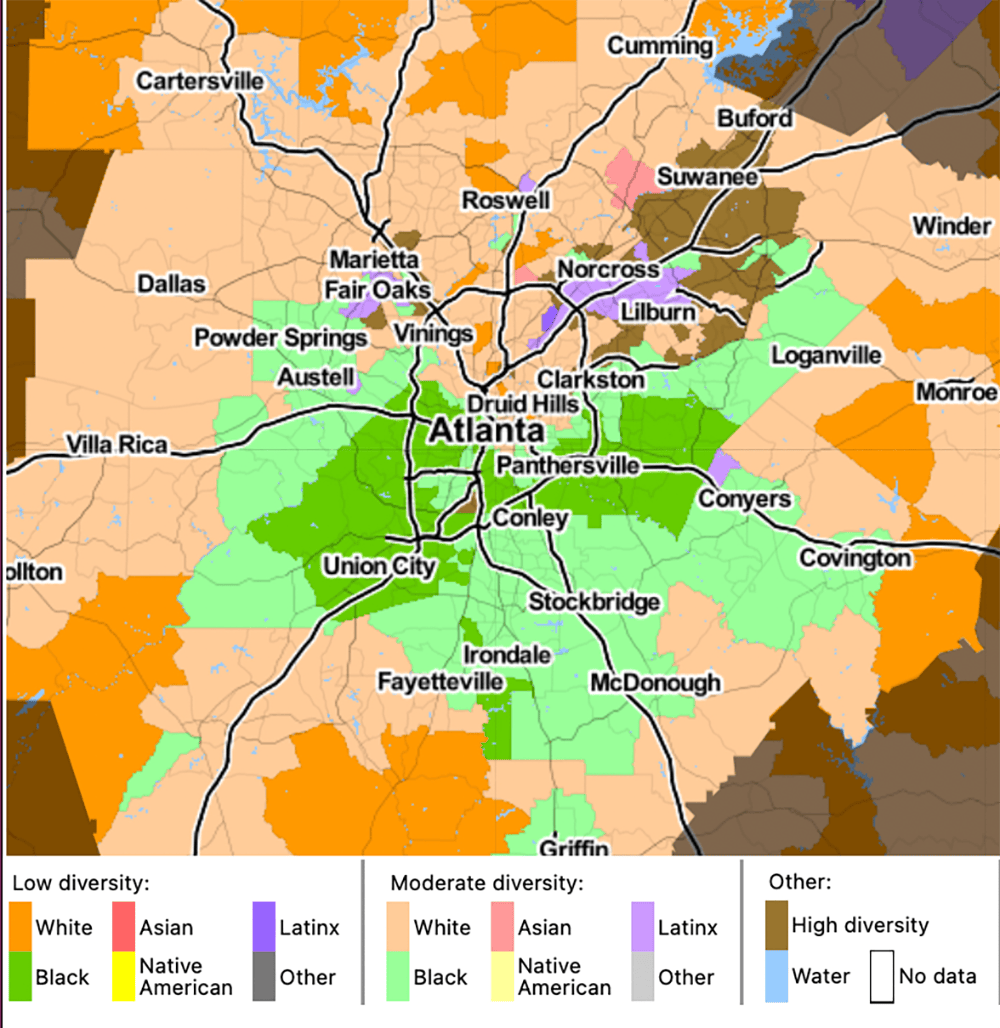

Baltimore Shows How Historic Segregation Shapes Biased Policing Today . Mapping Segregation The New York Times Baltimore . A Close Up Picture Of Partisan Segregation Among 180 Million Voters Partisan Dot Maps Promo . Mapping Inequality 2020map . Segregation Map America S Cities 50 Years After The Fair Housing Act HOU All 2016


:focal(392x220:393x221)/https://tf-cmsv2-smithsonianmag-media.s3.amazonaws.com/filer_public/ee/c2/eec296e5-13f2-4889-b20a-ad89f75ca16f/screenshot_2024-05-14_at_20047pm.png)
Trump Dropped Policy Prohibiting Contractors From Having 21trump News Segregated Facilities1 V2 . The Truth Behind Segregated US BBC Reel P09pmfr6 . Segregation Map America S Cities 50 Years After The Fair Housing Act CHI All 2016 . Landmark Berkeley Segregation Report Updated With Latest Data Segregation Map 2 . This Map Lets You See How School Segregation Has Changed In Your Screenshot 2024 05 14 At 20047pm


Infographic A Map Of Racial Segregation In America Fast Company 1673284 Poster 1280 Mappeople . Interactive Map Inside U S School Segregation By Race Class The 74 SXSW Finance Lead 2 825x495 . Incredibly Detailed Map Shows Race Segregation Across America In Original . Incredibly Detailed Map Shows Race Segregation Across America In Original . How Segregated Is YOUR State Map Reveals Racial Divides Across The US 3145042 Image A 39


Where School Segregation Is Still Happening Across The US Digital Journal Us School Segregation Map 01 . 68 Years After Brown Schools Still Highly Segregated 4 Takeaways Screen Shot 2022 05 16 At 11.36.07 AM 800x370 . Infographic A Map Of Racial Segregation In America Fast Company 1673284 Inline 48 States View . 1919 And 1960 3096691 Orig . Segregation US Civil Rights Movement 3931737